
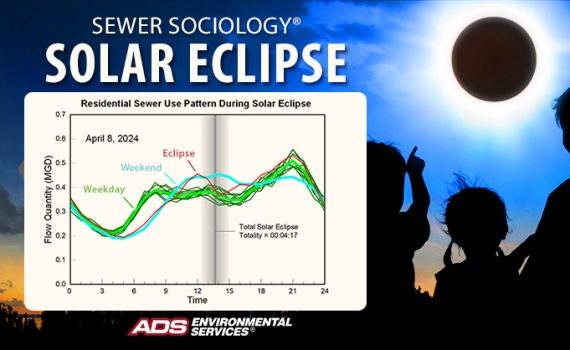
Did you catch the solar eclipse on Monday? I sure did . . . through the eyes of a sewer. A total solar eclipse is a big deal and generates […]
Sewer Sociology
11 posts
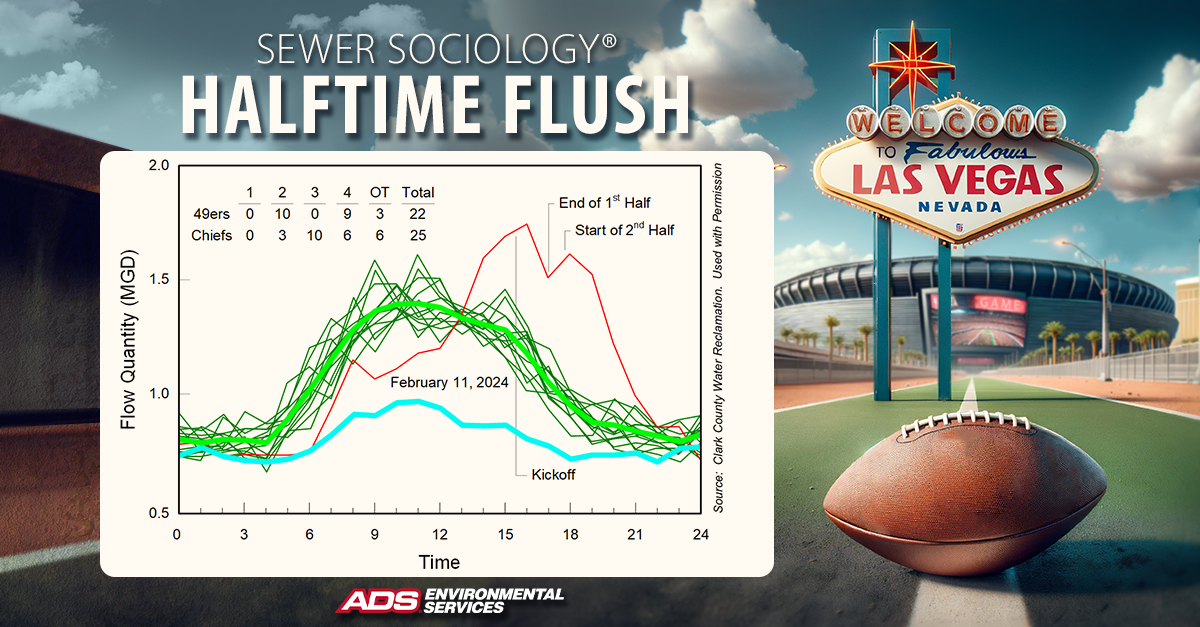
Did you catch the Big Game? I sure did! While tens of thousands of exhilarated fans descended upon Super Bowl LVIII in Las Vegas and millions more gathered to watch the game […]
World Trade Center Attack September 11, 2001 is a defining moment in U.S. history, and its memories and emotions echo through the words of the 9/11 Commission: At 8:46 on […]
Religious Observances Certain religious practices can also be observed in sewer use patterns. This composite hydrograph shows normal dry weather flow patterns from a flow monitor located in a region […]
Religious Observances Certain religious practices can also be observed in sewer use patterns. This composite hydrograph shows normal dry weather flow patterns from a flow monitor located in a region […]
Holidays Holidays are welcomed diversions from everyday life and provide time to celebrate and relax with family and friends. These diversions are reflected in sewer use patterns, as shown below. […]