
Northeast Blackout Millions of people were left without power on August 14, 2003 at 4:09 PM when the largest blackout in the history of North America occurred. The blackout began […]
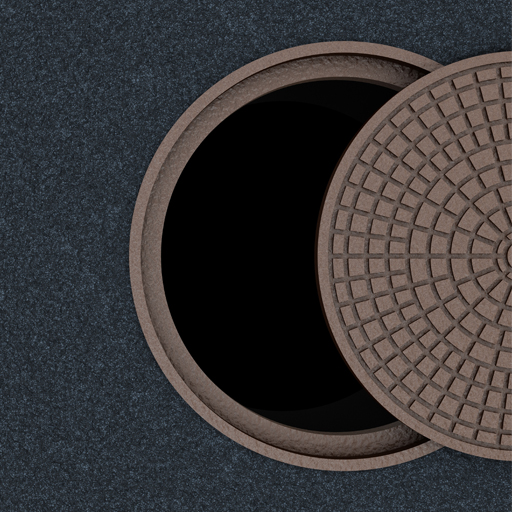
Sewer Sociology
11 posts
College Football College football games are big-time events in big-time college towns as students, alumni, and fans descend upon campus for a day of spirited festivities. Flow monitoring data from […]
Land use within a particular area can impact the shape of the diurnal pattern. The examples below represent diurnal patterns from six different land use areas. The residential pattern is […]
The Australian Open is held each year in Melbourne, Australia and is one of four Grand Slam tennis tournaments, attracting top-ranked professional and junior players from around the world. Flow […]
What is Sewer Sociology? Sewers are an important part of our society. They serve to promote public health, protect the environment, and support economic growth within our communities. They also […]