April 8, 2024: Total Solar Eclipse
Did you catch the solar eclipse on Monday? I sure did . . . through the eyes of a sewer. A total solar eclipse is a big deal and generates a lot of interest. This means that a sewer sociologist smells a good story. Take a look.
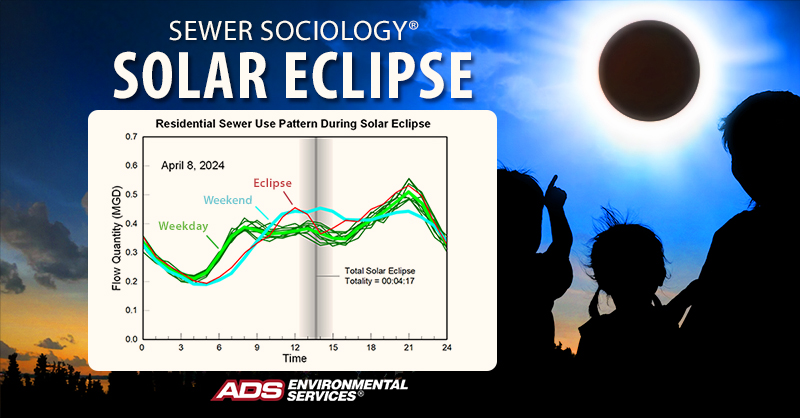
Sewer use from a residential area in Central Texas located in the path of totality is shown in the graph below. Typical weekdays are shown in green. Typical weekends are shown in blue, and the day of the solar eclipse is shown in red. Note that even though the eclipse occurred on a weekday, this day starts out like a weekend as schools were canceled for the day and many people took the day off. Totality occurred around 1:30 PM, and sewer use decreased accordingly as residents took a collective pause to enjoy this unique celestial event. After the eclipse, sewer use returned to its normal weekday pattern as life returned to normal.