08. Debris Amusement
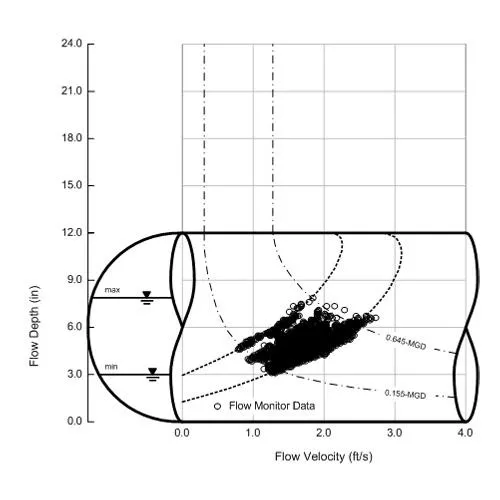
The scattergraph depicted here reveals shifting debris that reduces the pipe capacity at this monitoring location. The iso-Qs depict the average daily minimum and maximum flow rates. As the debris accumulates, the same daily flow rates are carried under deeper and slower conditions. The Manning Equation is applied using the Stevens-Schutzbach Method to determine that the debris accumulation results in a capacity loss of 25.5%.
You may also like

Published October 27, 2022
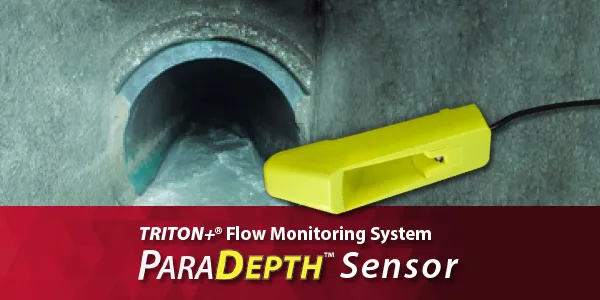
ParaDepth™ Non-Contact Depth Sensor for Use with ADS® TRITON+® Monitors
October 10, 2022 – ADS® announced availability of the new ParaDepth™ non-contact, depth sensor, used with the ADS TRITON+® flow monitors and […]

Published October 31, 2023
New ForeSITE™-UL Ultrasonic Monitoring is Fully Compatible with ADS PRISM™ Suite
ADS Environmental Services® has announced release of its all-new ForeSITE™ ultrasonic level monitoring system (FS-UL) for surface and storm water applications. This […]